This course is an introduction to data cleaning, analysis and visualization. We …
This course is an introduction to data cleaning, analysis and visualization. We will teach the basics of data analysis through concrete examples. You will learn how to take raw data, extract meaningful information, use statistical tools, and make visualizations. This was offered as a non-credit course during the Independent Activities Period (IAP), which is a special 4-week term at MIT that runs from the first week of January until the end of the month.
"Introductory Business Statistics with Interactive Spreadsheets - 1st Canadian Edition" is an …
"Introductory Business Statistics with Interactive Spreadsheets - 1st Canadian Edition" is an adaptation of Thomas K. Tiemann's book, "Introductory Business Statistics". In addition to covering basics such as populations, samples, the difference between data and information, and sampling distributions, descriptive statistics and frequency distributions, normal and t-distributions, hypothesis testing, t-tests, f-tests, analysis of variance, non-parametric tests, and regression basics, the following information has been added: the chi-square test and categorical variables, null and alternative hypotheses for the test of independence, simple linear regression model, least squares method, coefficient of determination, confidence interval for the average of the dependent variable, and prediction interval for a specific value of the dependent variable. This new edition also allows readers to learn the basic and most commonly applied statistical techniques in business in an interactive way -- when using the web version -- through interactive Excel spreadsheets. All information has been revised to reflect Canadian content.
This book contains content originally posted to the Math Support Center Resources …
This book contains content originally posted to the Math Support Center Resources page, a blog run by student tutors and staff at the University of Baltimore. The chapters are mostly organized according to the tagging system of the source blog and may include references to specific math and statistics courses offered by the university.
In this class, students use data and systems knowledge to build models …
In this class, students use data and systems knowledge to build models of complex socio-technical systems for improved system design and decision-making. Students will enhance their model-building skills, through review and extension of functions of random variables, Poisson processes, and Markov processes; move from applied probability to statistics via Chi-squared t and f tests, derived as functions of random variables; and review classical statistics, hypothesis tests, regression, correlation and causation, simple data mining techniques, and Bayesian vs. classical statistics. A class project is required.
The course focuses on the problem of supervised learning within the framework …
The course focuses on the problem of supervised learning within the framework of Statistical Learning Theory. It starts with a review of classical statistical techniques, including Regularization Theory in RKHS for multivariate function approximation from sparse data. Next, VC theory is discussed in detail and used to justify classification and regression techniques such as Regularization Networks and Support Vector Machines. Selected topics such as boosting, feature selection and multiclass classification will complete the theory part of the course. During the course we will examine applications of several learning techniques in areas such as computer vision, computer graphics, database search and time-series analysis and prediction. We will briefly discuss implications of learning theories for how the brain may learn from experience, focusing on the neurobiology of object recognition. We plan to emphasize hands-on applications and exercises, paralleling the rapidly increasing practical uses of the techniques described in the subject.
" This course develops logical, empirically based arguments using statistical techniques and …
" This course develops logical, empirically based arguments using statistical techniques and analytic methods. Elementary statistics, probability, and other types of quantitative reasoning useful for description, estimation, comparison, and explanation are covered. Emphasis is on the use and limitations of analytical techniques in planning practice."
This subject is on regional energy-environmental modeling rather than on general energy-environmental …
This subject is on regional energy-environmental modeling rather than on general energy-environmental policies, but the models should have some policy relevance. We will start with some discussion of green accounting issues; then, we will cover a variety of theoretical and empirical topics related to spatial energy demand and supply, energy forecasts, national and regional energy prices, and environmental implications of regional energy consumption and production. Where feasible, the topics will have a spatial dimension. This is a new seminar, so we expect students to contribute material to the set of readings and topics covered during the semester.
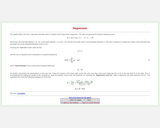
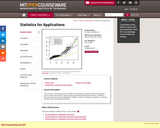
This applet from Statistical Java allows the user to generate bivariate data …
This applet from Statistical Java allows the user to generate bivariate data for analysis with simple linear regression. The page describes the equations used to generate the data and estimate the regression lines.
As teachers of statistics, we know that residual plots and other diagnostics …
As teachers of statistics, we know that residual plots and other diagnostics are important to deciding whether or not linear regression is appropriate for a set of data. Despite talking with our students about this, many students might believe that if the correlation coefficient is strong enough, these diagnostic checks are not important. The data set included in this activity was created to lure students into a situation that looks on the surface to be appropriate for the use of linear regression but is instead based (loosely) on a quadratic function.
This activity is an advanced version of the “Keep your eyes on …
This activity is an advanced version of the “Keep your eyes on the ball” activity by Bereska, et al. (1999). Students should gain experience with differentiating between independent and dependent variables, using linear regression to describe the relationship between these variables, and drawing inference about the parameters of the population regression line. Each group of students collects data on the rebound heights of a ball dropped multiple times from each of several different heights. By plotting the data, students quickly recognize the linear relationship. After obtaining the least squares estimate of the population regression line, students can set confidence intervals or test hypotheses on the parameters. Predictions of rebound length can be made for new values of the drop height as well. Data from different groups can be used to test for equality of the intercepts and slopes. By focusing on a particular drop height and multiple types of balls, one can also introduce the concept of analysis of variance.
The Food and Drug Administration requires pharmaceutical companies to establish a shelf …
The Food and Drug Administration requires pharmaceutical companies to establish a shelf life for all new drug products through a stability analysis. This is done to ensure the quality of the drug taken by an individual is within established levels. The purpose of this out-of-class project or in-class example is to determine the shelf life of a new drug. This is done through using simple linear regression models and correctly interpreting confidence and prediction intervals. An Excel spreadsheet and SAS program are given to help perform the analysis.
This course focuses on the problem of supervised learning from the perspective …
This course focuses on the problem of supervised learning from the perspective of modern statistical learning theory starting with the theory of multivariate function approximation from sparse data. It develops basic tools such as Regularization including Support Vector Machines for regression and classification. It derives generalization bounds using both stability and VC theory. It also discusses topics such as boosting and feature selection and examines applications in several areas: Computer Vision, Computer Graphics, Text Classification and Bioinformatics. The final projects and hands-on applications and exercises are planned, paralleling the rapidly increasing practical uses of the techniques described in the subject.
Introductory statistics course developed through the Ohio Department of Higher Education OER …
Introductory statistics course developed through the Ohio Department of Higher Education OER Innovation Grant. The course is part of the Ohio Transfer Module and is also named TMM010. For more information about credit transfer between Ohio colleges and universities please visit: www.ohiohighered.org/transfer.Team LeadKameswarrao Casukhela Ohio State University – LimaContent ContributorsEmily Dennett Central Ohio Technical CollegeSara Rollo North Central State CollegeNicholas Shay Central Ohio Technical CollegeChan Siriphokha Clark State Community CollegeLibrarianJoy Gao Ohio Wesleyan UniversityReview TeamAlice Taylor University of Rio GrandeJim Cottrill Ohio Dominican University
Sometimes it is difficult to measure or find information on a variable …
Sometimes it is difficult to measure or find information on a variable of interest. The problem then is to use information from easily measurable variables to find the needed information. Naturally, the variables to use must be related to the variable of interest. In this module we will study about relationships between two quantitative variables. We will explore some standard mathematical (linear, quadratic, cubic, etc.) forms of relationships.Learning Objectives:Identify response and explanatory variablesGiven bivariate data make a scatterplot of data and predict the pattern and strength of the relationship between the variablesLinear relationshipDefine correlation, study its properties and use themFind correlation for a bivariate data and interpret the resultsInterpret the square of the correlationTest for the significance of correlation – set up hypothesis and interpret the p-value of the testLinear relationship – Estimate the linear relationship between the two variables.Interpret slope and intercept.Interpret the square of the correlationStudy residuals and residual plots,Distinguish between the terms correlation and causationTest for the significance of the slope coefficient – set up hypothesis and interpret the p-value of the test.Study quadratic and other non-linear models.Textbook Material - Chapter 12 – Correlation and Regression – Pages 673 - 699
This course is a broad treatment of statistics, concentrating on specific statistical …
This course is a broad treatment of statistics, concentrating on specific statistical techniques used in science and industry. Topics include: hypothesis testing and estimation, confidence intervals, chi-square tests, nonparametric statistics, analysis of variance, regression, correlation, decision theory, and Bayesian statistics.
No restrictions on your remixing, redistributing, or making derivative works. Give credit to the author, as required.
Your remixing, redistributing, or making derivatives works comes with some restrictions, including how it is shared.
Your redistributing comes with some restrictions. Do not remix or make derivative works.
Most restrictive license type. Prohibits most uses, sharing, and any changes.
Copyrighted materials, available under Fair Use and the TEACH Act for US-based educators, or other custom arrangements. Go to the resource provider to see their individual restrictions.