This lab uses statistics and demographic data on the City of Baltimore. …
This lab uses statistics and demographic data on the City of Baltimore. We will enter, format, and analyze that data in Microsoft Excel. Please note: this lab is written for a beginner in Excel and meant to introduce you to various capabilities of Excel. You may feel the need to skip through some steps if you are experienced with Excel, and that is fine. Just make sure you understand the content of the lab! Future work will build on these skills.
This activity will take students through the steps of visualizing crime data …
This activity will take students through the steps of visualizing crime data in Baltimore City and calculating hot and cold spots using the Geti-Ord GI* tool using the ArcMap software application.
This activity will take students through the steps of visualizing Maryland's Congressional districts …
This activity will take students through the steps of visualizing Maryland's Congressional districts and calucalting the Polsby-Popper Test and interpreting the results using GIS with the ArcMap software application. This documents contains the instructors guide to the "Exploring Gerrymandering in Maryland with GIS" activity. Contents:Information about the scope and content of the activityRecommended readingsActivity Questions
This activity will take students through the steps of visualizing population and …
This activity will take students through the steps of visualizing population and cacluating population density using GIS with the ArcMap software application.
This activity will take students through the steps of calculating and intepreting …
This activity will take students through the steps of calculating and intepreting the Digital Divide Index using GIS with the ArcMap software application.
This activity will take students through the steps of calculating and intepreting …
This activity will take students through the steps of calculating and intepreting the Dissimilarity Index using GIS with the ArcMap software application.
This resource consists of three parts: a review of tonicity worksheet, a …
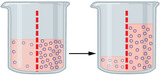
This resource consists of three parts: a review of tonicity worksheet, a crossword puzzle focusing on osmosis, and a powerpoint containing authentic data for analysis as well as questions.
Introduction to seismic theory, measurements and processing of seismic data to final …
Introduction to seismic theory, measurements and processing of seismic data to final focussed image for geological and/or physical interpretation.This course deals with the most important aspects of reflection seismics. Theory of seismic waves, aspects of data acquisition (seismic sources, receivers and recorders), and of data processing (CMP processing, velocity analysis, stacking, migration) will be dealt with. The course will be supplemented by a practical of 6 afternoons where the students will see the most important data-processing steps via exercises (in Matlab).
As the scale and scope of data collection continue to increase across …
As the scale and scope of data collection continue to increase across virtually all fields, statistical learning has become a critical toolkit for anyone who wishes to understand data. An Introduction to Statistical Learning provides a broad and less technical treatment of key topics in statistical learning. This book is appropriate for anyone who wishes to use contemporary tools for data analysis.
This website provides a resource for the heritability of all human traits …
This website provides a resource for the heritability of all human traits that have been investigated with the classical twin design. The traits have been classified into 28 broad trait domains, as well as according to the standard classification schemes of the International Classification of Functioning, Disability and Health (ICF) or the International Classification of Diseases and Related Health Problems (ICD-10). Currently the database includes information from 2748 papers, published between 1958 and 2012, reporting on 17804 traits on a total of 14,558,903 twin pairs. Have Fun!
This book contains content originally posted to the Math Support Center Resources …
This book contains content originally posted to the Math Support Center Resources page, a blog run by student tutors and staff at the University of Baltimore. The chapters are mostly organized according to the tagging system of the source blog and may include references to specific math and statistics courses offered by the university.
This tutorial introduces the reader to some of the amazing capabilities of …
This tutorial introduces the reader to some of the amazing capabilities of R to work with and map geographic data. Geographic data are data that contain spatial attributes (or spatial data) that define a geographic space (location, area, elevation, etc.) and non spatial attributes (f.e., population density, pollutant concentrations, temperature).
This tutorial was developed for one the units of the course “ENVS 420: Research Seminar in Environmental Sciences” offered at the University of Baltimore. However, it is hoped that readers outside of ENVS 420 who are interested in geospatial analysis and with a basic familiarity of R find this tutorial useful.
The use of an integrated developer environment (IDE) or an IDE like configuration such as the IDE RStudio (https://rstudio.com/) or the Nvim-R plug-in for the integration of vim/neovim and R (https://github.com/ jalvesaq/Nvim-R/tree/stable) is recommended but not necessary.
The tutorial was written with RMarkdown (v. 2.6) (Allaire et al., 2020; Xie et al., 2018, 2020) in R (v. 4.2.3) (R Core Team, 2020).
This activity will take students through the steps of visualizing and intepreting the …
This activity will take students through the steps of visualizing and intepreting the distribution and spread of hte Sika Deer in Maryland using GIS with the ArcMap software application.
No restrictions on your remixing, redistributing, or making derivative works. Give credit to the author, as required.
Your remixing, redistributing, or making derivatives works comes with some restrictions, including how it is shared.
Your redistributing comes with some restrictions. Do not remix or make derivative works.
Most restrictive license type. Prohibits most uses, sharing, and any changes.
Copyrighted materials, available under Fair Use and the TEACH Act for US-based educators, or other custom arrangements. Go to the resource provider to see their individual restrictions.