In this class, students use data and systems knowledge to build models …
In this class, students use data and systems knowledge to build models of complex socio-technical systems for improved system design and decision-making. Students will enhance their model-building skills, through review and extension of functions of random variables, Poisson processes, and Markov processes; move from applied probability to statistics via Chi-squared t and f tests, derived as functions of random variables; and review classical statistics, hypothesis tests, regression, correlation and causation, simple data mining techniques, and Bayesian vs. classical statistics. A class project is required.
Dawson (1995) presented a data set giving a population at risk and …
Dawson (1995) presented a data set giving a population at risk and fatalities for an “unusual episode” (the sinking of the ocean liner Titanic) and discussed the use of the data set in a first statistics course as an elementary exercise in statistical thinking, the goal being to deduce the origin of the data. Simonoff (1997) discussed the use of this data set in a second statistics course to illustrate logistic regression. Moore (2000) used an abbreviated form of the data set in a chapter exercise on the chi-square test. This article describes an activity that illustrates contingency table (two-way table) analysis. Students use contingency tables to analyze the “unusual episode” data (from Dawson 1995) and attempt to use their analysis to deduce the origin of the data. The activity is appropriate for use in an introductory college statistics course or in a high school AP statistics course.
This course covers descriptive statistics, the foundation of statistics, probability and random …
This course covers descriptive statistics, the foundation of statistics, probability and random distributions, and the relationships between various characteristics of data. Upon successful completion of the course, the student will be able to: Define the meaning of descriptive statistics and statistical inference; Distinguish between a population and a sample; Explain the purpose of measures of location, variability, and skewness; Calculate probabilities; Explain the difference between how probabilities are computed for discrete and continuous random variables; Recognize and understand discrete probability distribution functions, in general; Identify confidence intervals for means and proportions; Explain how the central limit theorem applies in inference; Calculate and interpret confidence intervals for one population average and one population proportion; Differentiate between Type I and Type II errors; Conduct and interpret hypothesis tests; Compute regression equations for data; Use regression equations to make predictions; Conduct and interpret ANOVA (Analysis of Variance). (Mathematics 121; See also: Biology 104, Computer Science 106, Economics 104, Psychology 201)
Introductory statistics course developed through the Ohio Department of Higher Education OER …
Introductory statistics course developed through the Ohio Department of Higher Education OER Innovation Grant. The course is part of the Ohio Transfer Module and is also named TMM010. For more information about credit transfer between Ohio colleges and universities please visit: www.ohiohighered.org/transfer.Team LeadKameswarrao Casukhela Ohio State University – LimaContent ContributorsEmily Dennett Central Ohio Technical CollegeSara Rollo North Central State CollegeNicholas Shay Central Ohio Technical CollegeChan Siriphokha Clark State Community CollegeLibrarianJoy Gao Ohio Wesleyan UniversityReview TeamAlice Taylor University of Rio GrandeJim Cottrill Ohio Dominican University
Math in Society is a free, open textbook. This book is a …
Math in Society is a free, open textbook. This book is a survey of mathematical topics, most non-algebraic, appropriate for a college-level topics course for liberal arts majors. The text is designed so that most chapters are independent, allowing the instructor to choose a selection of topics to be covered. Emphasis is placed on the applicability of the mathematics. Material for each topic is covered in the main text, with additional depth available through exploration exercises appropriate for in-class, group, or individual investigation.
Lab and Homework Site available through Lumens OHM but requires an access code.
Mathematics explained: Here you find videos on various math topics: Pre-university Calculus …
Mathematics explained: Here you find videos on various math topics:
Pre-university Calculus (functions, equations, differentiation and integration) Vector calculus (preparation for mechanics and dynamics courses) Differential equations, Calculus Functions of several variables, Calculus Linear Algebra Probability and Statistics
This course is an introduction to statistical data analysis. Topics are chosen …
This course is an introduction to statistical data analysis. Topics are chosen from applied probability, sampling, estimation, hypothesis testing, linear regression, analysis of variance, categorical data analysis, and nonparametric statistics.
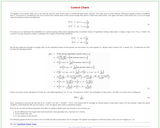
This course covers the design, construction, and testing of field robotic systems, …
This course covers the design, construction, and testing of field robotic systems, through team projects with each student responsible for a specific subsystem. Projects focus on electronics, instrumentation, and machine elements. Design for operation in uncertain conditions is a focus point, with ocean waves and marine structures as a central theme. Topics include basic statistics, linear systems, Fourier transforms, random processes, spectra, ethics in engineering practice, and extreme events with applications in design.
As teachers of statistics, we know that residual plots and other diagnostics …
As teachers of statistics, we know that residual plots and other diagnostics are important to deciding whether or not linear regression is appropriate for a set of data. Despite talking with our students about this, many students might believe that if the correlation coefficient is strong enough, these diagnostic checks are not important. The data set included in this activity was created to lure students into a situation that looks on the surface to be appropriate for the use of linear regression but is instead based (loosely) on a quadratic function.
The applets in this section allow you to see how the common …
The applets in this section allow you to see how the common Xbar control chart is constructed with known variance. The Xbar chart is constructed by collecting a sample of size n at different times t.
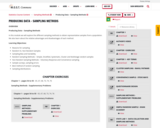
Producing Data – Sampling MethodsIn this module we will explore the different …
Producing Data – Sampling MethodsIn this module we will explore the different sampling methods to obtain representative samples from a population. We also learn about the relative advantages and disadvantages of each method. Learning Objectives:Reasons for samplingRandom Vs. Non-Random SamplesSampling Bias and VariabilityRandom Sampling Methods – Simple, Stratified, Systematic, Cluster and Multistage random samplesNon-Random Sampling Methods – Voluntary Response and Convenience samplingSample surveys, sampling errorsBest method of random samplingSampling distributions
We hope readers will take away three ideas from this book in …
We hope readers will take away three ideas from this book in addition to forming a foundation of statistical thinking and methods.
(1) Statistics is an applied field with a wide range of practical applications.
(2) You don't have to be a math guru to learn from interesting, real data.
(3) Data are messy, and statistical tools are imperfect. However, when you understand the strengths and weaknesses of these tools, you can use them to learn interesting things about the world.
In order to promote students’ conceptual understanding and learning experience in introductory …
In order to promote students’ conceptual understanding and learning experience in introductory statistics, a technology task, which focuses on the probability distribution in which means are defined, was created using TinkerPlots, an exploratory data analysis and modeling software. The targeted audiences range from senior high school grade levels to college freshmen who are starting their introductory course in statistics. Students will be guided to explore and discover the movement behaviors of means of a set of numbers randomly generated from a fixed range of values characterized by a predetermined probability distribution. The cognitive, mathematical, technological and pedagogical natures of the task, as well as its association with the statistics education framework based on the Guidelines for Assessment and Instruction in Statistics Education (GAISE) by the American Statistical Association, will be elaborated. A brief discussion on what cognitive design principles this task satisfies will also be provided at the end.
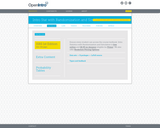
This textbook is part of the OpenIntro Statistics series and offers complete …
This textbook is part of the OpenIntro Statistics series and offers complete coverage of the high school AP Statistics curriculum. Real data and plenty of inline examples and exercises make this an engaging and readable book. Links to lecture slides, video overviews, calculator tutorials, and video solutions to selected end of chapter exercises make this an ideal choice for any high school or Community College teacher. In fact, Portland Community College recently adopted this textbook for its Introductory Statistics course, and it estimates that this will save their students $250,000 per year. Find out more at: openintro.org/ahss
View our video tutorials here: openintro.org/casio openintro.org/TI
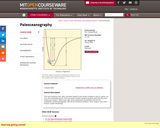
" This class examines tools, data, and ideas related to past climate …
" This class examines tools, data, and ideas related to past climate changes as seen in marine, ice core, and continental records. The most recent climate changes (mainly the past 500,000 years, ranging up to about 2 million years ago) will be emphasized. Quantitative tools for the examination of paleoceanographic data will be introduced (statistics, factor analysis, time series analysis, simple climatology)."
No restrictions on your remixing, redistributing, or making derivative works. Give credit to the author, as required.
Your remixing, redistributing, or making derivatives works comes with some restrictions, including how it is shared.
Your redistributing comes with some restrictions. Do not remix or make derivative works.
Most restrictive license type. Prohibits most uses, sharing, and any changes.
Copyrighted materials, available under Fair Use and the TEACH Act for US-based educators, or other custom arrangements. Go to the resource provider to see their individual restrictions.